Fluctuations in Hydration Levels due to increase in Exercises
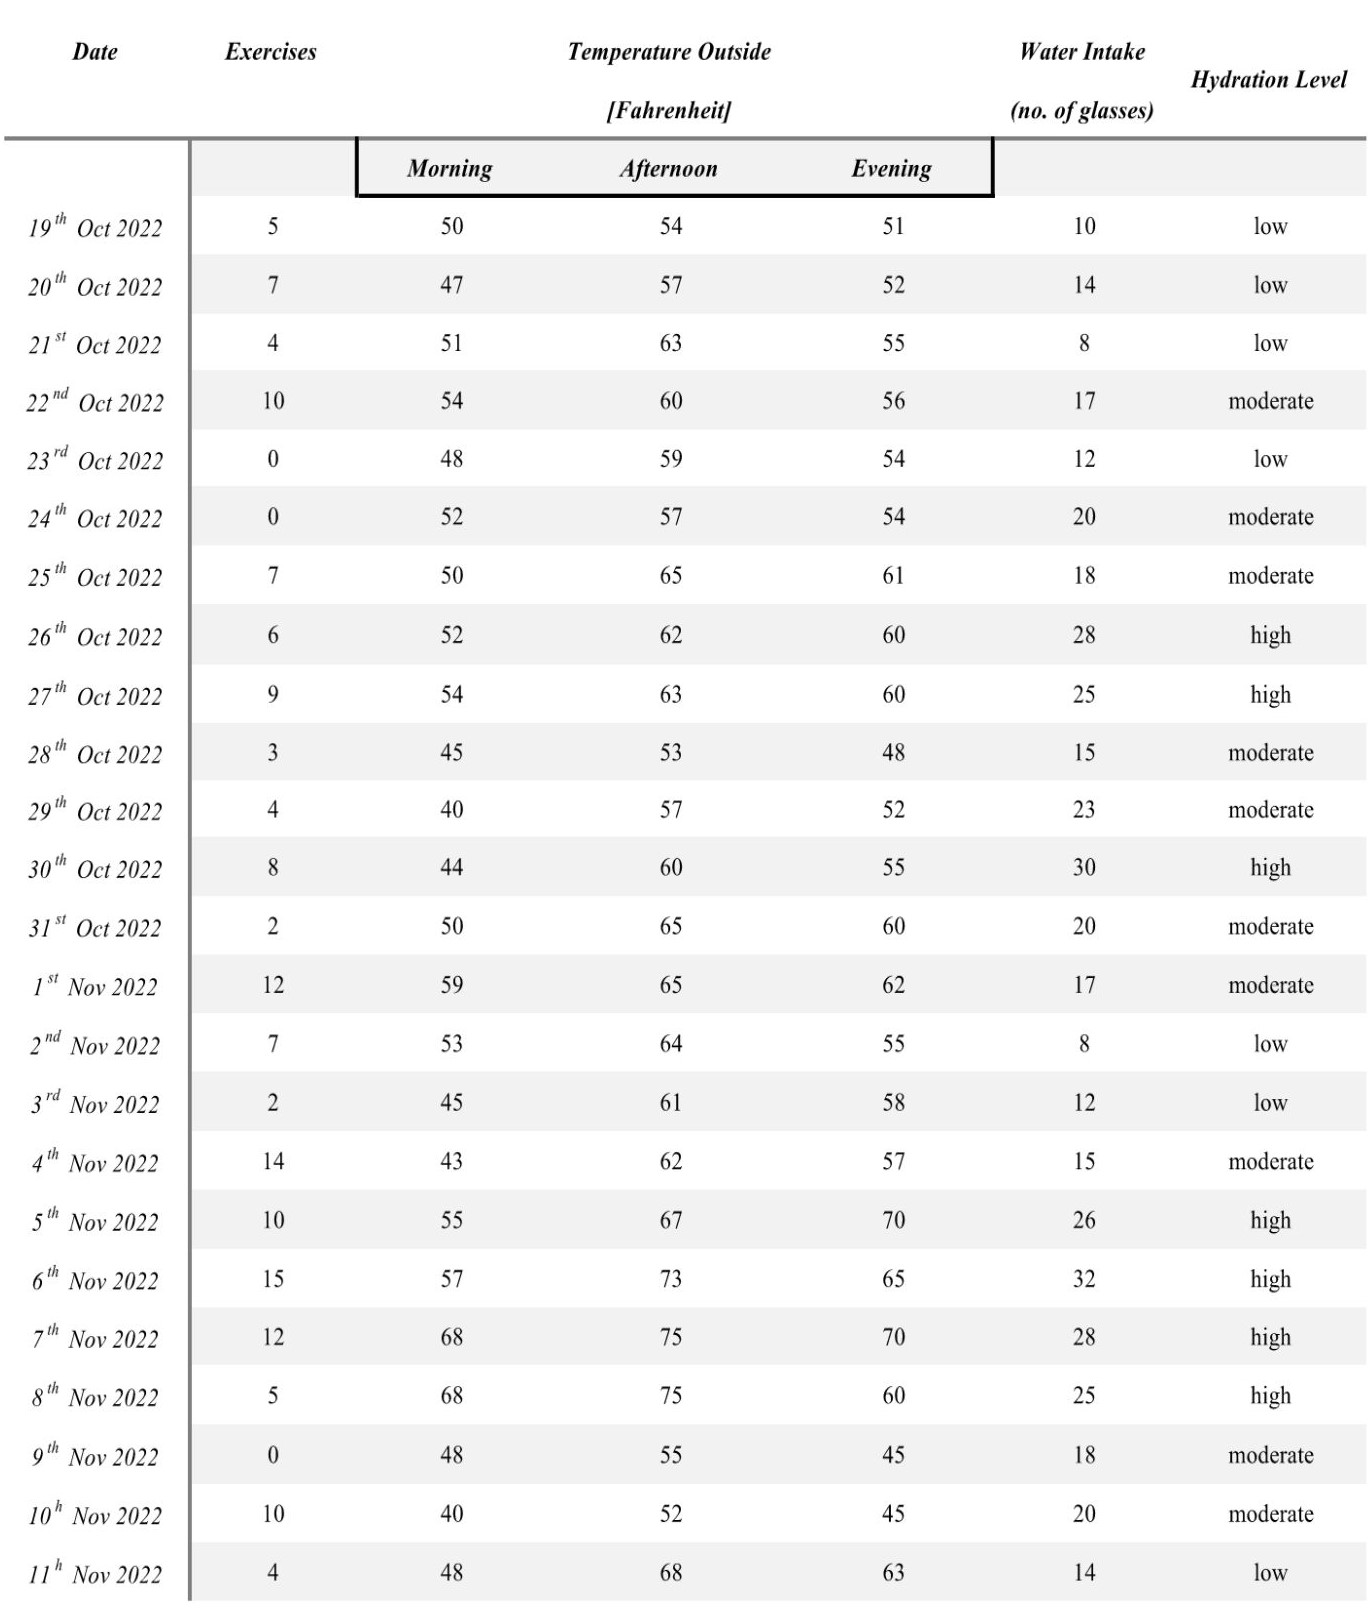
Hypothesis: As my number of exercises increases, my hydration levels increases. In addition, due to the outside temperature, my hydration levels have fluctuations.
Explanation :
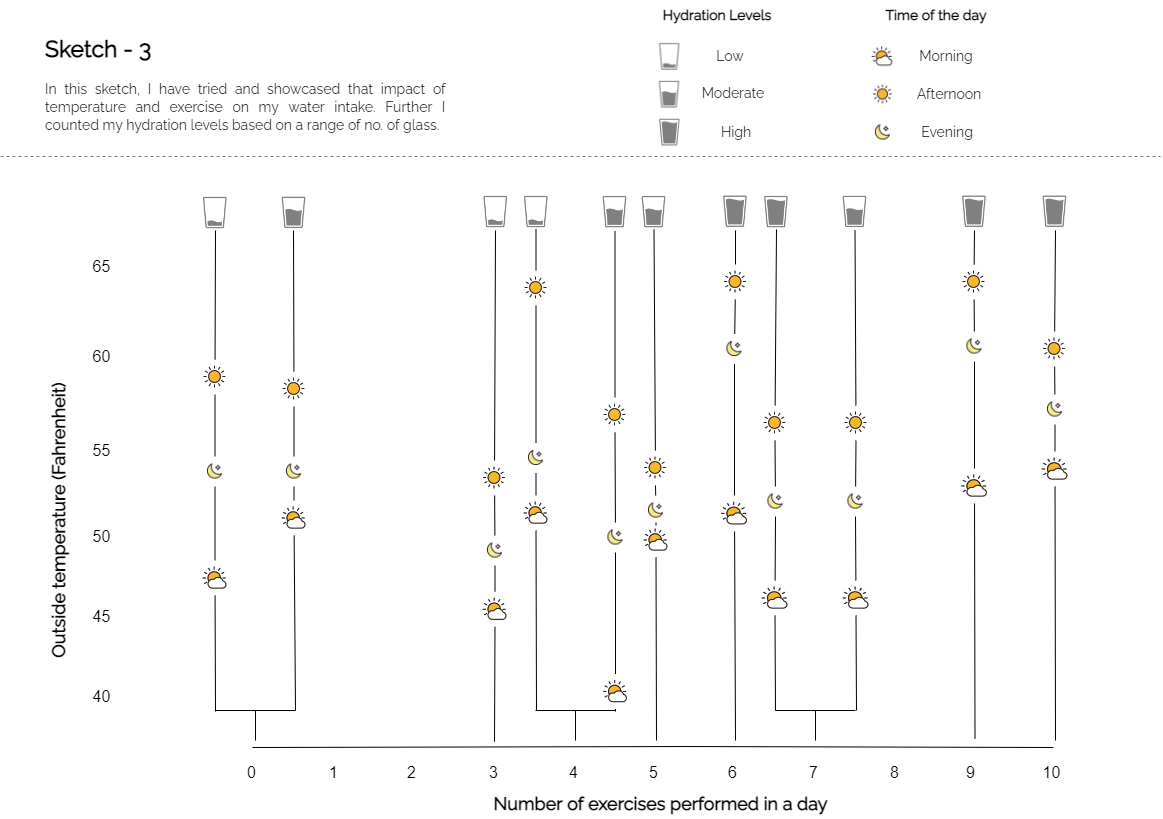
The visualization above depicts 5 variables as follows :
- Days : the days is when the data was collected which is represented as the vertical lines.
- Number of Exercises : the number of exercises performed in a day is shown on X-axis.
- The outside Temperature : the temperature outside is in fahrenheit is shown on the Y-axis.
- The timezone in the day : the timezone is divide in three i.e. Morning, Afternoon, Evening and is represented as images and the key is given to understand.
- Hydration Level : hydration level is calculated on the basis of number of glasses consumed in a day and is represented as glasses and the levels are shown by how much the glass is filled.
Conclusion :
The more I exercise, I tend to drink water more, which affects my hydration levels but if the outside temperature is on the hotter side then my hydration levels are at peak because of increase in exercise and hot climate. However, if the outside temperature is on the colder side and if I am out side, then hydration level drops but if I am inside then due to the heater my hydration levels are moderate.
Data Collected and Sketch :

